Wednesday, January 16, 2019

load a config file onto a Cisco router

How to load a config file onto a Cisco router

Plug the blue serial cable [known as a console cable] that came with your Cisco router into the console port on the router and the serial port in your computer. Start up your favourite terminal program (such as HyperTerminal - select "Direct to COMx"). The correct terminal settings are 9600 baud, 8 data bits, no parity, 1 stop bit, and I usually choose hardware flow control. For reliability, you also need to set the line delay to 100ms (File/Properties/Settings/ASCII Setup).
If the router is on, switch it off. Now turn the router on. Note that it takes about two minutes for router to complete booting. If the router asks if you want to run the setup wizard, say no. If it asks you if you want to get started tap return a couple of times. If you get nothing within 30 seconds of turning the router on, tap return a few times. If you still get nothing then check your serial connections and parameters.
For safety, lets start by wiping the routers current config. Enter these commands:
enable
erase nvram:
Erasing the nvram filesystem will remove all configuration files! Continue? [confirm]
Press "y" to erase the routers config. Then enter the below commands. Note that the router may not ask you to save the current config. If it does, make sure you say no - we are trying to wipe the config.
reload
System configuration has been modified. Save? [yes/no]: no
Proceed with reload? [confirm]
Press "y" to let the router reboot. For those people who have some familiarity with Cisco routers the "erase nvram:" command has supersede the "write erase" and "erase startup-config" commands (these commands all do the same thing).
When the router has completed booting this time it will ask if you want to run the setup wizard, say "no". It should eventually tell you to press "return to get started". Tap return a few times. Now we need to go into config mode:
enable
config terminal
Now copy the config you want to load onto the router into the clipboard (hint: CTRL-A then CTRL-C), and paste into HyperTerminal (Edit/Paste To Host). Once it has pasted in, you need to save the config.
CTRL-Z
copy running-config startup-config

Saturday, October 6, 2018

Firewalls

Security Policy
service
groups
service access allowed/restricted by group

2 types of firewalls

filtering - block selected packets at network layer by type, address, port
no password control - by ip so limited

proxy -
   application proxies
   SOCKS proxies - like a switch board

Firewall Architecture

There are lots of ways to structure your network to protect your systems using a firewall.
If you have a dedicated connections to the Internet through a router, you could plug the router directly into your firewall system. Or, you could go through a hub to provide for full access servers outside your firewall.

Dial-up Architecture

You may be using a dialup service like an ISDN line. In this case you might use a third network card to provide provide a filtered DMZ. This gives you full control over your Internet services and still separates them from your regular network.

                  __________
   _/\__/\_      |          |          _______________
  |        |     | Firewall |  (LAN)  |               |
 / Internet \----|  System  |--(HUB)--| Workstation/s |
 \_  _  _  _/    |__________|         |_______________|
   \/ \/ \/           |
                    (DMZ)
                    (HUB)

Single Router Architecture

If there is a router or cable modem between you and the Internet. If you own the router you could setup some hard filter rules in the router. If this router is owned by your ISP so you may not the have the needed controls. You can ask your ISP to put in filters.

                  _________           __________
   _/\__/\_      | Router  |         |          |          _______________
  |        |     |   or    |  (DMZ)  | Firewall |  (LAN)  |               |
 / Internet \----|Cable Mdm|--(HUB)--|  System  |--(HUB)--| Workstation/s |
 \_  _  _  _/    |_________|    |    |__________|         |_______________|
   \/ \/ \/                     |  
                            (Outside)    
                            (Server)

Firewall with Proxy Server

If you need to monitor where users of your network are going and your network is small, you can intergrate a proxy server into your firewall. ISP's some times do this to create interest list of their users to resell to marketing agencies.

                   __________
    _/\__/\_      | Proxy /  |          _______________
   |        |     | Firewall |  (LAN)  |               |
  / Internet \----|  System  |--(HUB)--| Workstation/s |
  \_  _  _  _/    |__________|         |_______________|
    \/ \/ \/  
You can put the proxy server on your LAN as will. In this case the firewall should have rules to only allow the proxy server to connect to the Internet for the services it is providing. This way the users can get to the Internet only through the proxy.

                  __________
   _/\__/\_      |          |          _______________
  |        |     | Firewall |  (LAN)  |               |
 / Internet \----|  System  |--(HUB)--| Workstation/s |
 \_  _  _  _/    |__________|    |    |_______________|
   \/ \/ \/                      |     ______________
                                 |    |              |
                                 +----| Proxy Server |
                                      |______________|

Redundent Internet Configuration

If you are going to run a service like YAHOO or maybe SlashDot you may want to make your system by using redundant routers and firewalls. (Check out the High Availability HowTo.)
By using a round-robin DNS techniques to provide access to multipule web servers from one URL and multiple ISP's, routers and firewalls using High Avaibility technics you can create a 100% uptime service.

   _/\__/\_                                     _/\__/\_  
  |        |                                   |        | 
 /  ISP #1  \______                 (WAN)_____/ Partners \
 \_  _  _  _/      |                (HUB)     \_  _  _  _/
   \/ \/ \/        |               ___|____     \/ \/ \/  
                 __|___           |_______ |
   _/\__/\_     |_____ |         |Firewall||          ______
  |        |   |      ||  (DMZ)  | System ||  (LAN)  |      |
 /  ISP #2  \--|Router||--(HUB)--|  (VPN) ||--(HUB)--| WS/s |
 \_  _  _  _/  |______|     |    |________|     |    |______|
   \/ \/ \/                 |         |         |     ______
          |             (Outside)  (Shared)     |    |      |
  ------  |             (Server)   (Server)     +----|Proxy |
 | WS/s | |                                          |______|
 | VPN  |-+
 |______|
It is easy to let your network get out of hand. Keep control of every connection. It only takes a user with a modem to compromise your LAN.

roll your own
After making all the setting you need you should recompile, reinstall the kernel and reboot.
I use the command:
make dep;make clean;make bzlilo;make modules;make modules_install;init 6 to accomplish all of this in one step.

secure the firewall
Look in your /etc/inetd.conf file. This file configures inetd also known as the "super server". It controls a bunch of the server daemons and starts them as they are requested by a packet arriving at a "well known" port.
You should turn off echo, discard, daytime, chargen, ftp, gopher, shell, login, exec, talk, ntalk, pop-2, pop-3, netstat, systat, tftp, bootp, finger, cfinger, time, swat and linuxconfig if you have one.
To turn a service off, put # as the first character of the service line. When your done, send a SIG-HUP to the process by typing "kill -HUP <pid>", where <pid> is the process number of inetd. This will make inetd re-read its configuration file (inetd.conf) and restart without taking your system down.

Test this by telneting to port 15 (netstat) on firewall. If you get any output you have not turned these services off.
telnet localhost 19
You can also create the file /etc/nologin. Put a few line of text in it like (BUZZ OFF). When this file exists, login will not allow user to logon. They will see the contents of this file and their logins refused. Only root can logon.
You can also edit the file /etc/securetty. If the user is root, then the login must be occurring on a tty listed in /etc/securetty. Failures will be logged with the syslog facility. With both of these controls in place the only way to logon to the firewall will be as root from the console.
NEVER EVER TELNET to a system and log IN AS ROOT. If you need remote root access SSH (Secure Shell). You might even turn off telnet.
If you are really paranoid you need to be using lids (Linux Intrusion Detect System). It is an intrusion detection system patch for the Linux kernel; it can protect important files from being changed. When it's in effect, no one (including root) can change the protected files or directories and their sub-directories. You have to reboot the system with a security=1 LILO setting to modify secure files. (I'd also boot into single user mode.)

IP filtering setup (IPCHAINS)

Linux ipchains is a rewrite of the Linux IPv4 firewalling code and a rewrite of ipfwadm, which was a rewrite of BSD's ipfw, I believe. It is required to administer the IP packet filters in Linux kernel versions 2.1.102 and above.
The older code doesn't deal with fragments, has 32-bit counters (on Intel at least), doesn't allow specification of protocols other than TCP, UDP or ICMP, can't make large changes atomically, can't specify inverse rules, has some quirks, and can be tough to manage (making it prone to user error). Or so the author says.
I'm not going to get real deep into how to control an IPChains firewall because there is a GREAT!! HOWTO on it athttp://www.adelaide.net.au/~rustcorp/ipfwchains/ipfwchains.html. I'd just end up duplicating it here. Here are the basics.
You work with chains by name. You start with three built-in chains input, output and forward which you can't delete. You can create chains of your own. Rules can then be added and deleted from these rule sets.

webmin


Monday, June 25, 2018

The Command:

Get-Module -ListAvailable

brings a large number of modules to the screen, many of which are labeled "Net", and therefore are of particular interest to the administrator when they need information about their network and corresponding hardware, such as the network adapter. Another command of this type:

Get-Command -Module NetTCPIP

then shows again which commands are available within the NetTCPIP module. System administrators who need information about their network will usually use the "ipconfig" command - which can also be started directly from the PowerShell command line. Similar to "netsh", however, the user often has to torment himself by going through various submenus before he gets the desired information. 
Selecting the corresponding PowerShell Cmdlet makes it much easier. If you need information on the IP address, you can get it with the following command:

Get-NetIPAddress

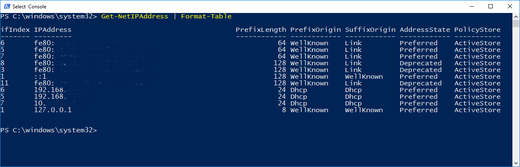
It will then display both the configuration information for the IPv4 and the IPv6 addresses for all network adapters in the system. On a server system with multiple network cards, many entries are displayed. Those who are then overwhelmed by the wealth of information displayed can filter the output accordingly. If only the basic information is needed, usually the Format-Table Cmdlet (to which the output is passed by means of a pipeline) helps:

Get-NetIPAddress | Format-Table

Of course, it is also possible to reduce the output to just the addresses in the IPv4 range:

Get-NetIPAddress -Addressfamily IPv4 | Format-Table

A very useful Cmdlet also displays all the network interfaces installed on the computer directly:

Get-NetAdapter

Again, it is easily possible to filter the output further. For example, when it comes to listing only the existing WLAN interfaces:

Get-NetAdapter -Name "WLAN"

The commands and thus also the gained information are truly flexible due to the fact that the PowerShell commands can be linked by means of a pipeline (as already briefly shown with Format-Table). What about, for example, displaying only the IP addresses in the system that were assigned via DHCP? To do so, we first use the Get-NetIPAddress Cmdlet, which displays the existing IP addresses. This output is passed to "Where-Object". There, the addresses that were assigned by DHCP are then filtered out by comparing the prefix (-eq stands for "equal"). Once again forwarded to "Select-Object", then only the name and the IP address of the found interfaces are displayed:
Get-NetIPAddress |
  Where-Object PrefixOrigin -eq dhcp |
  Select-Object -Property IPAddress, InterFaceAlias
Even these few examples clearly show the potential in PowerShell network commands, which can also be used remotely on other Windows systems. System managers and administrators should familiarize themselves with these possibilities, and in this way, create their own library with scripts for network support. A good starting point for everything about PowerShell can be found on the Internet in the blog "Hey Scripting Guy!"(part of Microsoft TechNet). But there are simple scripts for beginners, as well as complex, more comprehensive solutions and examples.

Saturday, June 9, 2018

Deploy Windows 10 with System Center 2012 R2 Configuration Manager


For more details on the setup for this topic, please see Deploy Windows 10 with the Microsoft Deployment Toolkit.
figure 1
Figure 1. The machines used in this topic.

In this section

Components of Configuration Manager operating system deployment

Operating system deployment with Configuration Manager is part of the normal software distribution infrastructure, but there are additional components. For example, operating system deployment in Configuration Manager may use the State Migration Point role, which is not used by normal application deployment in Configuration Manager. This section describes the Configuration Manager components involved with the deployment of an operating system, such as Windows 10.
  • State migration point (SMP). The state migration point is used to store user state migration data during computer replace scenarios.
  • Distribution point (DP). The distribution point is used to store all packages in Configuration Manager, including the operating system deployment-related packages.
  • Software update point (SUP). The software update point, which is normally used to deploy updates to existing machines, also can be used to update an operating system as part of the deployment process. You also can use offline servicing to update the image directly on the Configuration Manager server.
  • Reporting services point. The reporting services point can be used to monitor the operating system deployment process.
  • Boot images. Boot images are the Windows Preinstallation Environment (Windows PE) images Configuration Manager uses to start the deployment.
  • Operating system images. The operating system image package contains only one file, the custom .wim image. This is typically the production deployment image.
  • Operating system installers. The operating system installers were originally added to create reference images using Configuration Manager. Instead, we recommend that you use MDT Lite Touch to create your reference images. For more information on how to create a reference image, see Create a Windows 10 reference image.
  • Drivers. Like MDT Lite Touch, Configuration Manager also provides a repository (catalog) of managed device drivers.
  • Task sequences. The task sequences in Configuration Manager look and feel pretty much like the sequences in MDT Lite Touch, and they are used for the same purpose. However, in Configuration Manager the task sequence is delivered to the clients as a policy via the Management Point (MP). MDT provides additional task sequence templates to Configuration Manager.
    Note Configuration Manager SP1 along with the Windows Assessment and Deployment Kit (ADK) for Windows 10 are required to support management and deployment of Windows 10.

See also


https://docs.microsoft.com/en-us/windows/deployment/deploy-windows-sccm/deploy-windows-10-with-system-center-2012-r2-configuration-manager

Thursday, May 31, 2018

Tracing a port

telnet to switch
ping IP of the device you want to find the port for
which adds the mac to the arp table
sh arp | include "ipaddress"
sh mac-address-table | include "last 4 of mac"

========================================
Identify a portion of the ports without interrupting users use MAC address tables to find devices connected to switch ports. Trace which patch panel port a switch port is connected to and which wall jack individual machines are connected to.  If you need to do it manually you can get the MAC addresses of known active devices, ping it to make sure the MAC is in the switches switching table and then check the switches dynamic MAC address table (that is if you have smart switches)

====================================================
LinkSprinter is super useful for network mapping! Basically it will tell you for any switch that supports discover protocols (CDP/LLDP/EDP) the switch name, port number, VLAN, etc. on that drop. Then you'll get an email, or you can use the mobile interface for the online results management platform, and comment the location (you can use name, cube number, room, etc.). So you'd go around, plug into a drop, 10 seconds later that data would be stored for you, you'd comment the location, and move on to the next drop. Then you could sit down with all of that info and label everything! Much simpler and quicker than using a toner and two people.

I spoke with one university that used to test all of their drops in every dorm every summer. That project would normally take a month to complete, and they did it with one LinkSprinter in a week.

=================================================
Toner and someone to help is the way we tend to go with this.  We also have several custom internal tools to show us where a mac address is plugged in on the network
======================================================

Firstly, you need to get the MAC address, so get into a machine on the same VLAN and look at its neighbour table - Windows is netsh int ipv4 show neigh, Linux: ip nei Cisco: show ip arp x.x.x.x. Once you have that...
If this is a discovery job on a layer 2 switch, do show mac address-table | i 0011.2233.4455 - replacing the mac address bytes as appropriate.
If on the other hand it's a router, use show ip arp | i 0011.2233.4455 - again replacing the MAC as appropriate. Obviously when you were getting the MAC, if it turned out to be directly connected to that router, you're already done.
Long-term however, I heartily recommend that you setup LLDP (failing that, CDP) to your hosts so that you can identify them from either side. lldpd is an absolutely excellent LLDP daemon for Linux that also supports CDP, EDP, SONMP and FDP. If you're currently able to reach the host and it does happen to run linux/BSD, I'd recommend skipping the above and just turn on LLDP.
Regardless of whether your switch is performing frame forwarding (layer 2) or packet routing (layer 3), the following should work if the switch has a management IP address in the same subnet as the host you want to find:
  1. At the switch, ping the IP address you want to find. If the address is on the same subnet as the switch's management address, an ARP request will be sent looking for the MAC address of the host.
  2. Now you can look at the ARP cache and find the MAC address of the host you are looking for (show ip arp) and its corresponding interface.
  3. You can also look for its MAC address table entry by issuing: show mac-address table address [the address]
Regardless of whether your switch is performing frame forwarding (layer 2) or packet routing (layer 3), the following should work if the switch has a management IP address in the same subnet as the host you want to find:
  1. At the switch, ping the IP address you want to find. If the address is on the same subnet as the switch's management address, an ARP request will be sent looking for the MAC address of the host.
  2. Now you can look at the ARP cache and find the MAC address of the host you are looking for (show ip arp) and its corresponding interface.
  3. You can also look for its MAC address table entry by issuing: show mac-address table address [the address]
The CAM table on the switch matches the MAC address to the device port. Use 'show mac address-table' on the switch. You can also configure port descriptions to help find devices later too.

you want to find: 1.At the switch, ping the IP address you want to find. If the address is on the same subnet as the switch's management address, an ARP request will be sent looking for the MAC address of the host. 2.Now you can look at the ARP cache and find the MAC address of the host you are looking for (show ip arp) and its corresponding interface. 3.You can also look for its MAC address table entry by issuing: show mac-address table address [the address]

The answer depends on whether the switch is a Layer 2 or a Layer 3 switch. That is to say, is the switch only switching and relaying traffic on to a different device for routing, or, is it doing the routing decisions itself via SVIs (switched virtual interfaces).
On a layer 3 switch, the port can be found by using a few simple commands on the device. However on a layer 2 switch, you have to log into both the switch and whatever device is doing the routing to locate the port.
In either case, the commands are the same, just run on two different boxes for the layer 2 switch.

On a Layer 3 switch:

  • Log into the switch and issue the following command (where ipaddress is the ip address of the host you are trying to locate:
    show ip arp *ipaddress*
    
  • The output should look similar to below, and give you the mac-address of the device (I've highlighted the mac-address below in bold).
    LYKINS-1861#show ip arp 172.20.1.100
    Protocol  Address          Age (min)  Hardware Addr   Type   Interface
    Internet  172.20.1.100            0   **28cf.da1d.1b05**  ARPA   Vlan10
    
  • Now issue one of the following commands (where mac-address is the hardware address from previous step). Depending on the Cisco platform, sometimes the command is listed in either form.
    show mac address-table address *mac-address*
    show mac-address-table address *mac-address*
    
  • The output should look similar to below, the port you are looking for should be listed as the Destination Port:
    LYKINS-1861#show mac-address-table address 28cf.da1d.1b05
    Destination Address  Address Type  VLAN  Destination Port
    -------------------  ------------  ----  --------------------
    28cf.da1d.1b05          Dynamic      10     **FastEthernet0/1/1**
    

On a Layer 2 switch:

  • Find out what device is doing the routing for this switch (you may have to look at the network documentation). Sometimes it is a "Router on a Stick", where the Layer 2 VLANs are being trunked up to the router for the Layer 3 decisions.
  • Log into the routing device, and issue the following command (where ipaddress is the ip address of the host you are trying to locate:
    show ip arp *ipaddress*
    
  • The output should look similar to below, and give you the mac-address of the device (listed below in bold).
    LYKINS-1861#show ip arp 172.20.1.100
    Protocol  Address          Age (min)  Hardware Addr   Type   Interface
    Internet  172.20.1.100            0   **28cf.da1d.1b05**  ARPA   Vlan10
    
  • Now log into the Layer 2 switch
  • On that device issue one of the following commands (where mac-address is the hardware address from previous step). Depending on the Cisco platform, sometimes the command is listed in either form.
    show mac address-table address *mac-address*
    show mac-address-table address *mac-address*
    
  • The output should look similar to below, the port you are looking for should be listed as the Destination Port:
    LYKINS-1861#show mac-address-table address 28cf.da1d.1b05
    Destination Address  Address Type  VLAN  Destination Port
    -------------------  ------------  ----  --------------------
    28cf.da1d.1b05          Dynamic      10     **FastEthernet0/1/1**

Thursday, May 17, 2018

inter vlan routing

router on a stick / inter vlan routing

1 physical port in trunk mode using subinterfaces to route traffic over more than 1 vlan using dot1q encapsulation

common reasons for problems
port configured as access instead of trunk
wrong encapsulation protocol
wrong vlan assigned
ipaddress wrong for vlans network class

https://www.certificationkits.com/cisco-certification/ccna-articles/cisco-ccna-vlans-virtual-lans/intervlan-routing-router-on-a-stick-a-configuration/


Monday, August 3, 2015

Understanding Trace

Understanding Trace


Cisco Unified Serviceability provides trace tools to assist you in troubleshooting issues with your voice application. Cisco Unified Serviceability supports SDI (System Diagnostic Interface) trace, SDL (Signaling Distribution Layer) trace (for Cisco CallManager and Cisco CTIManager services, applicable to Cisco Unified Communications Manager and Cisco Unified Communications Manager Business Edition only), and Log4J trace (for Java applications).

You use the Trace Configuration window to specify the level of information that you want traced as well the type of information that you want to be included in each trace file.

Unified CM and Unified CM BE only: If the service is a call-processing application such as Cisco CallManager or Cisco CTIManager, you can configure a trace on devices such as phones and gateway.

(Unified CM and Unified CM BE only: In the Alarm Configuration window, you can direct alarms to various locations, including SDI trace log files, or SDL trace log files. If you want to do so, you can configure trace for alerts in the Cisco Unified Real-Time Monitoring Tool (RTMT).

After you have configured information that you want to include in the trace files for the various services, you can collect and view trace files by using the trace and log central option in the Cisco Unified Real-Time Monitoring Tool.

Trace Configuration


You can configure trace parameters for any feature or network service that displays in Cisco Unified Serviceability. If you have clusters (Cisco Unified Communications Manager only), you can configure trace parameters for any feature or network service that is available on any Cisco Unified Communications Manager server in the cluster. Use the Trace Configuration window to specify the parameters that you want to trace for troubleshooting problems.

You can configure the level of information that you want traced (debug level), what information you want to trace (trace fields), and information about the trace files (such as number of files per service, size of file, and time that the data is stored in the trace files.) If you have clusters (Cisco Unified Communications Manager only), you can configure trace for a single service or apply the trace settings for that service to all servers in the cluster.

Unified CM and Unified CM BE only: If the service is a call-processing application such as Cisco CallManager or Cisco CTIManager, you can configure a trace on devices such as phones and gateways; for example, you can narrow the trace to all enabled phones with a directory number beginning with 555.

If you want to use predetermined troubleshooting trace settings rather than choosing your own trace fields, you can use the Troubleshooting Trace window. For more information on troubleshooting trace, see the "Troubleshooting Trace Settings" section.

After you have configured information that you want to include in the trace files for the various services, you can collect trace files by using the trace and log central option in RTMT. For more information regarding trace collection, see the "Trace Collection" section.

Troubleshooting Trace Settings


The Troubleshooting Trace Settings window allows you to choose the services in Cisco Unified Serviceability for which you want to set predetermined troubleshooting trace settings. In this window, you can choose a single service or multiple services and change the trace settings for those services to the predetermined trace settings. If you have clusters (Cisco Unified Communications Manager only), you can choose the services on different Cisco Unified Communications Manager servers in the cluster, so the trace settings of the chosen services get changed to the predetermined trace settings. You can choose specific activated services for a single server, all activated services for the server, specific activated services for all servers in the cluster, or all activated services for all servers in the cluster. In the window, N/A displays next to inactive services.


Note The predetermined troubleshooting trace settings for a Cisco Unified Communications Manager feature or network service include SDL (Cisco Unified Communications Manager and Cisco Unified Communications Manager Business Edition only), SDI, and Log4j trace settings. Before the troubleshooting trace settings get applied, the system backs up the original trace settings. When you reset the troubleshooting trace settings, the original trace settings get restored.


When you open the Troubleshooting Trace Settings window after you apply troubleshooting trace settings to a service, the service that you set for troubleshooting displays as checked. In the Troubleshooting Trace Settings window, you can reset the trace settings to the original settings.

After you apply Troubleshooting Trace Setting to a service, the Trace Configuration window displays a message that troubleshooting trace is set for the given service(s). From the Related Links drop-down list box, you can choose the Troubleshooting Trace Settings option if you want to reset the settings for the service. For the given service, the Trace Configuration window displays all the settings as read-only, except for some parameters of trace output settings; for example, Maximum No. of Files. You can modify these parameters even after you apply troubleshooting trace settings.

Trace Collection


Use Trace and Log Central, an option in the Cisco Unified Real-Time Monitoring Tool, to collect, view, and zip various service traces and/or other log files. With the Trace and Log Central option, you can collect SDL/SDI traces, Application Logs, System Logs (such as Event View Application, Security, and System logs), and crash dump files.


Tip To collect CSA logs, check the Cisco Security Agent check box in the Select System Logs tab in RTMT. To access user logs that provide information about users that are logging in and out, check the Security Logs check box in the Select System Logs tab.


Tip Do not use NotePad to view collected trace files.


Note Unified CM and Unified CM BE only: For devices that support encryption, the SRTP keying material does not display in the trace file.


For more information on trace collection, refer to the Cisco Unified Real-Time Monitoring Tool Administration Guide.

Trace Configuration and Collection Checklist


Table 6-1 provides an overview of the steps for configuring and collecting trace for feature and network services in Cisco Unified Serviceability.

Table 6-1 Trace Configuration and Collection Checklist 

Configuration Steps

Related Procedures and Topics

Step 1 

Do the applicable step:

Unified CM and Unified CM BE only: Choose System > Enterprise Parameters in Cisco Unified Communications Manager Administration and configure the maximum number of devices that are available for tracing. Enter a value in the Max Number of Device Level Trace field. The default specifies 12.

Connection only: Choose System Settings > Enterprise Parameters in Cisco Unity Connection Administration and configure the maximum number of devices that are available for tracing. Enter a value in the Max Number of Device Level Trace field. The default specifies 12.

Unified CM and Unified CM BE only:Cisco Unified Communications Manager Administration Guide

Connection only:System Administration Guide for Cisco Unity Connection

Step 2 

If you want to enable trace compression, do the applicable step:

Unified CM and Unified CM BE only: Choose System > Enterprise Parameters in Cisco Unified Communications Manager Administration and set the value of the Trace Compression parameter to Enabled.

Connection only: Choose System Settings > Enterprise Parameters in Cisco Unity Connection Administration and set the value of the Trace Compression parameter to Enabled.

•Configuring Trace and Log Central in RTMT, Cisco Unified Real-Time Monitoring Tool Administration Guide

Unified CM and Unified CM BE only:Cisco Unified Communications Manager Administration Guide

Connection only:System Administration Guide for Cisco Unity Connection

Step 3 

Configure the values of the TLC Throttling CPU Goal and TLC Throttling IOWait Goal service parameters (Cisco RIS Data Collector service) by doing the applicable step:


Connection only: Choose System Settings > Service Parameters in Cisco Unity Connection Administration and configure the values of the TLC Throttling CPU Goal and TLC Throttling IOWait Goal service parameters (Cisco RIS Data Collector service).

•Configuring Trace and Log Central in RTMT, Cisco Unified Real-Time Monitoring Tool Administration Guide

Unified CM and Unified CM BE only:Cisco Unified Communications Manager Administration Guide

Connection only:System Administration Guide for Cisco Unity Connection

Step 4 

Configure the trace setting for the service for which you want to collect traces. If you have clusters (Cisco Unified Communications Manager only), you can configure trace for the service on one server or on all servers in the cluster.

To configure trace settings, choose what information you want to include in the trace log by choosing the debug level and trace fields.

Unified CM and Unified CM BE only: You can also configure trace for specific devices if you are configuring trace for the Cisco CallManager service or the Cisco CTIManager service.

If you want to run predetermined traces on services, set troubleshooting trace for those services.


Step 5 

Install the Cisco Unified Real-Time Monitoring Tool on a local PC.

Cisco Unified Real-Time Monitoring Tool Administration Guide

Step 6 

If you want to generate an alarm when the specified search string exists in a monitored trace file, enable the LogFileSearchStringFound alert in RTMT.

You can find the LogFileSearchStringFound alarm in the LpmTctCatalog. (In Cisco Unified Serviceability, choose Alarms > Definitions. In the Find alarms where drop-down list box, choose the System Alarm Catalog; in the Equals drop-down list box, choose LpmTctCatalog.)

Cisco Unified Real-Time Monitoring Tool Administration Guide


Step 7 

If you want to automatically capture traces for alerts such as CriticalServiceDownand CodeYellow, check the Enable Trace Downloadcheck box in the Set Alert/Properties dialog box for the specific alert in RTMT; configure how often that you want the download to occur.

Cisco Unified Real-Time Monitoring Tool Administration Guide

Step 8 

Collect the traces.

Cisco Unified Real-Time Monitoring Tool Administration Guide

Step 9 

View the log file in the appropriate viewer.

Cisco Unified Real-Time Monitoring Tool Administration Guide

Step 10 

If you enabled troubleshooting trace, reset the trace settings services, so the original settings get restored.

Note Leaving Troubleshooting trace enabled for a long time increases the size of the trace files and may impact the performance of the services.


Where to Find More Information


Related Topics


Additional Cisco Documentation

Cisco Unified Real-Time Monitoring Tool Administration Guide

Unified CM BE and Connection onlyCisco Unity Connection Serviceability Administration Guide

Connection onlySystem Administration Guide for Cisco Unity Connection